Dashboard
Dashboard
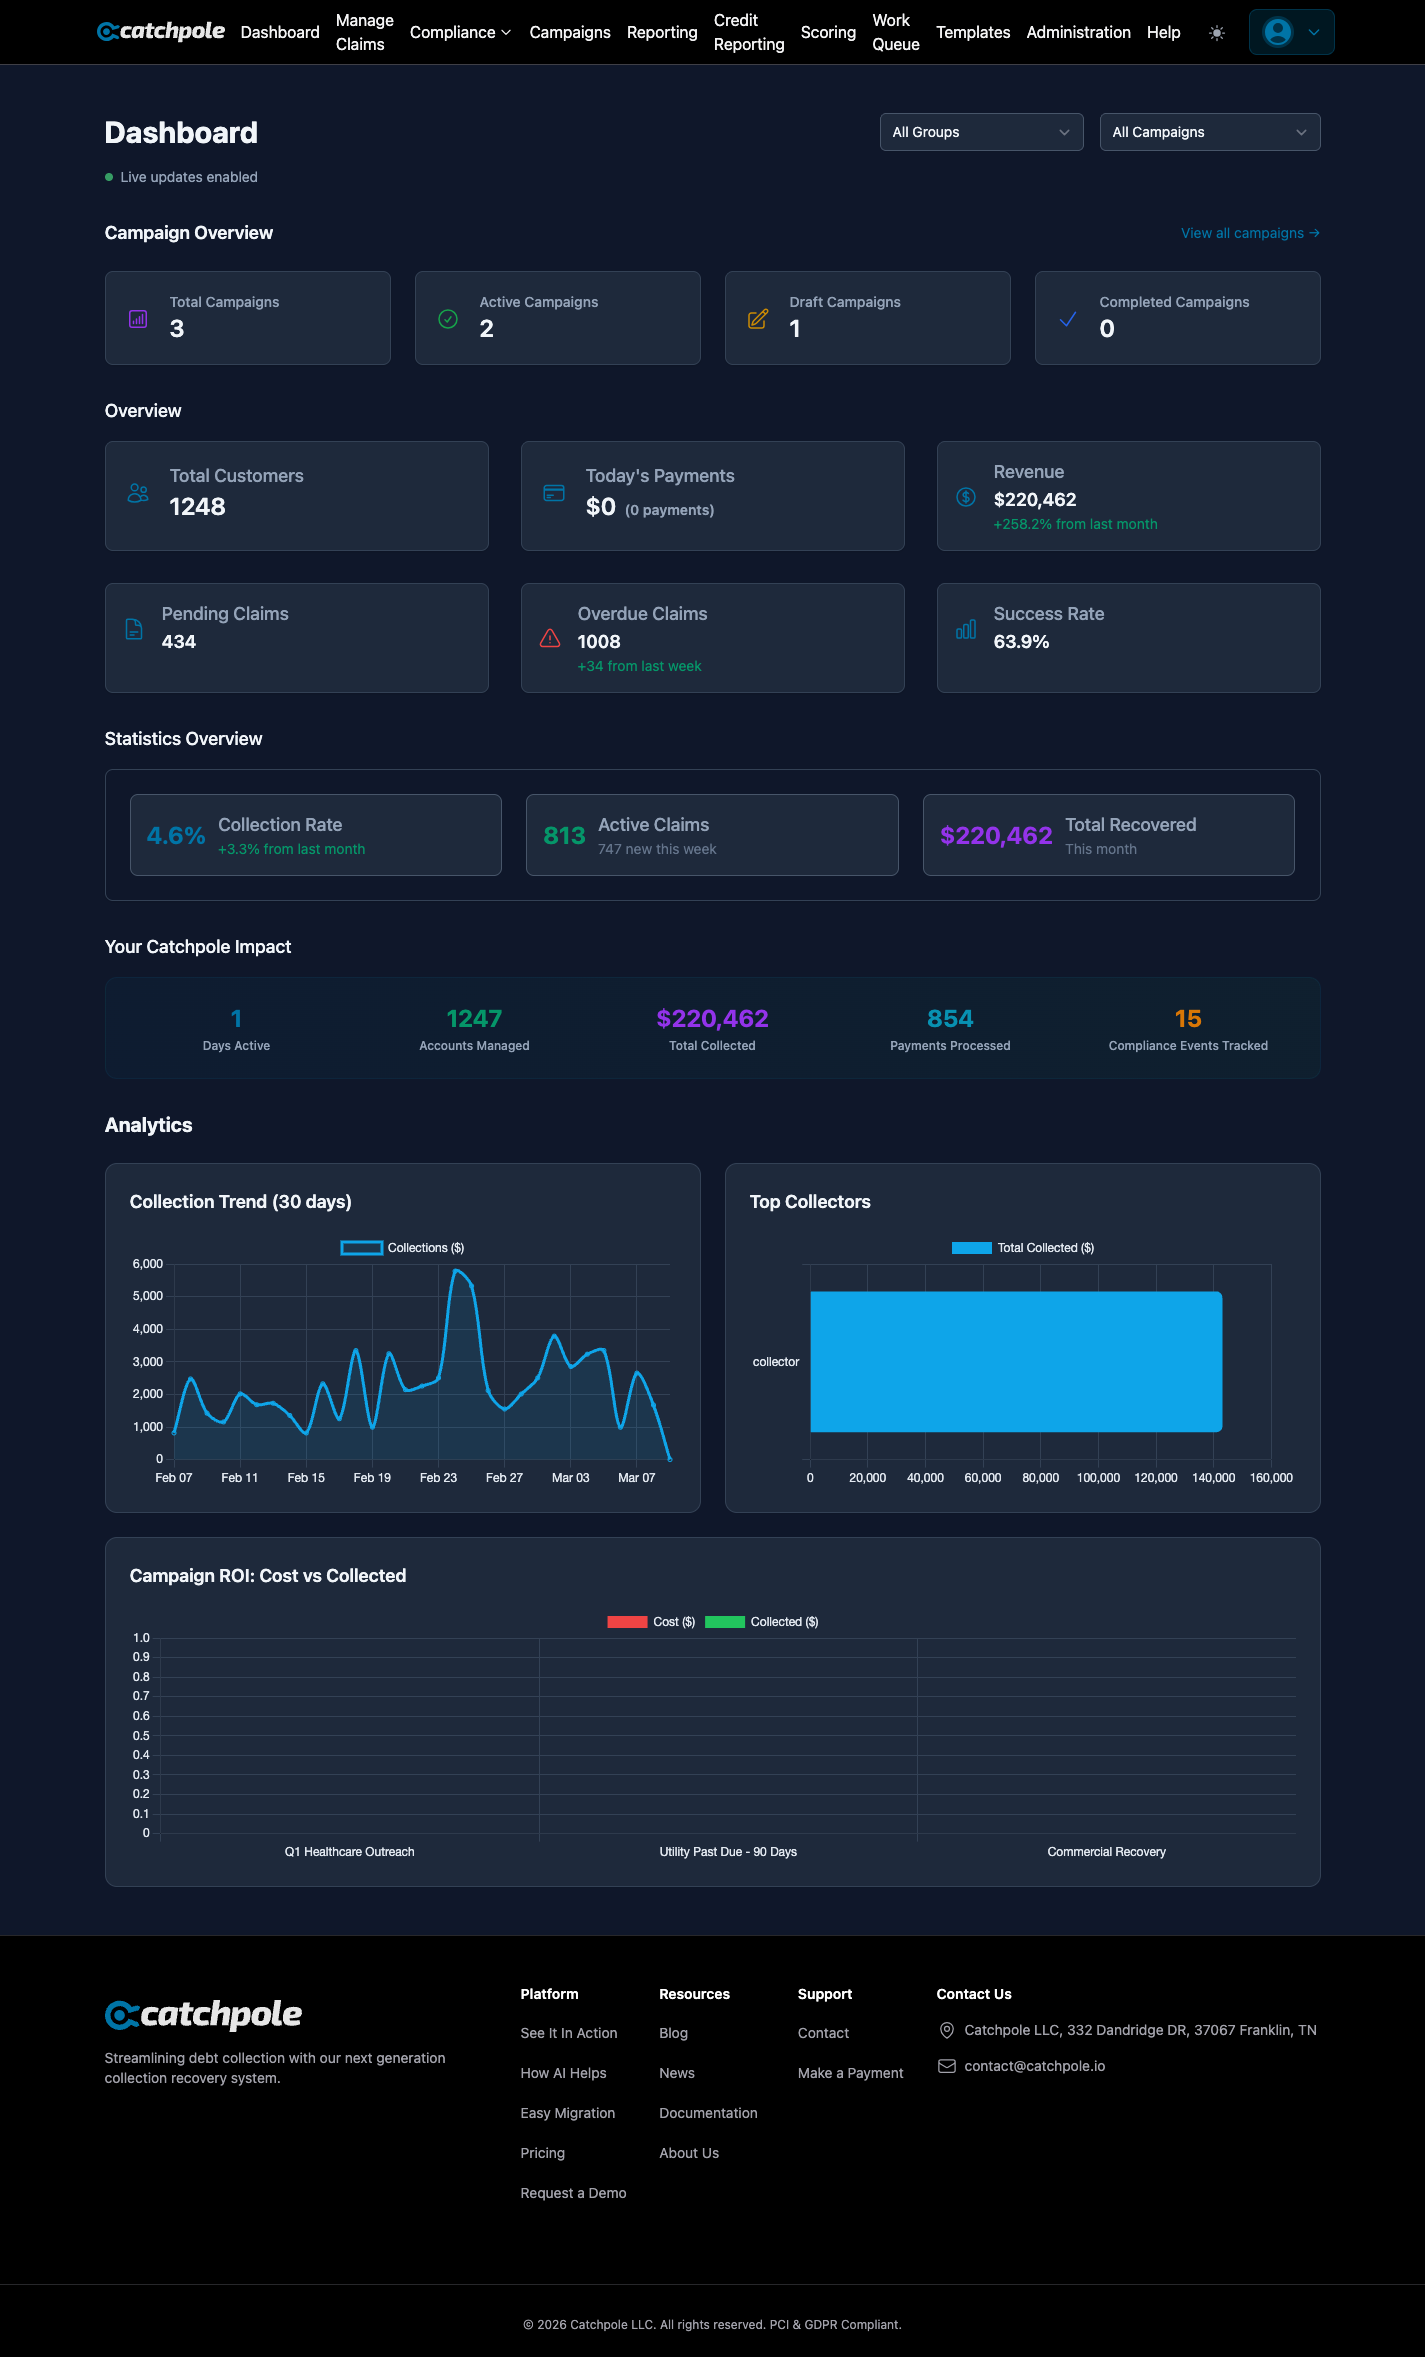
The Dashboard is your command center — a real-time overview of your entire collections operation. It’s the first screen you see after logging in and provides at-a-glance metrics on everything that matters.
Overview Metrics
The top-level cards show your most important numbers:
- Total Customers — the number of customer records in your organization
- Today’s Payments — payments received today with count
- Revenue — total collected amount with month-over-month comparison
- Pending Claims — claims awaiting action
- Overdue Claims — claims past their due date, with weekly trend
- Success Rate — your overall collection success percentage
Campaign Overview
Track all your outreach campaigns from the dashboard:
- Total Campaigns — all campaigns across statuses
- Active Campaigns — currently running campaigns
- Draft Campaigns — campaigns in preparation
- Completed Campaigns — finished campaign runs
Click View all campaigns to jump directly to the Campaign Builder.
Statistics Overview
Three key performance indicators give you a health check:
- Collection Rate — percentage of debts recovered, with trend comparison
- Active Claims — claims currently being worked, with new additions this week
- Total Recovered — dollar amount collected this month
Your Catchpole Impact
A running total of what the platform has helped you achieve:
- Days Active
- Accounts Managed
- Total Collected
- Payments Processed
- Compliance Events Tracked
Analytics Charts
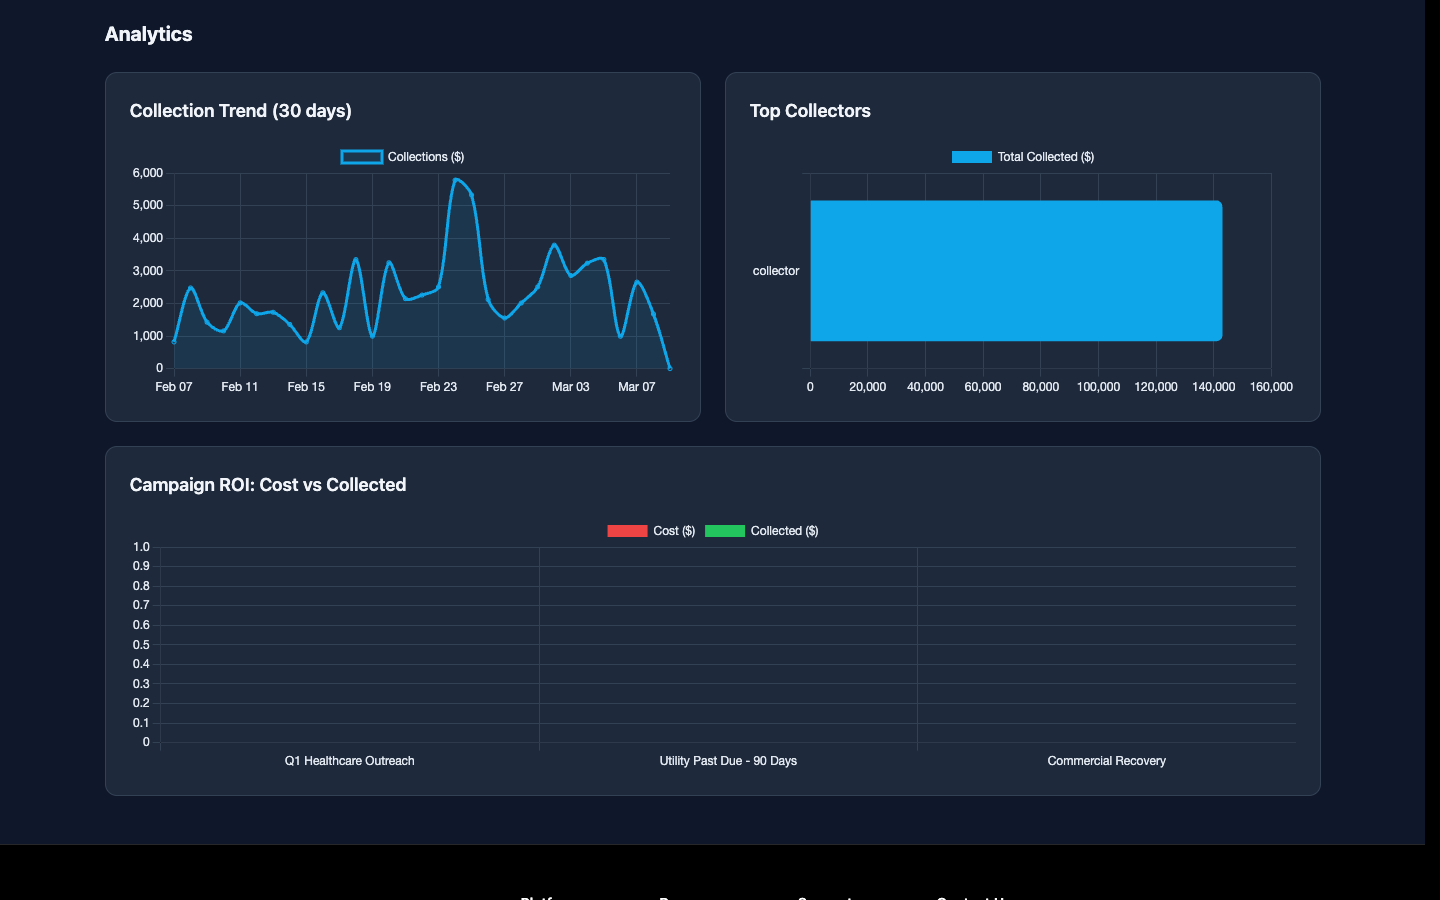
Visual charts help you spot trends:
- Collection Trend (30 days) — line chart showing daily collection amounts over the past month
- Top Collectors — bar chart ranking your team by total collected
Filtering
Use the dropdown filters at the top to segment your dashboard by:
- Claim Group — filter by specific claim groups (e.g., Healthcare, Commercial, Utility)
- Campaign — filter by a specific campaign
The dashboard updates in real time with live updates enabled — no need to refresh.